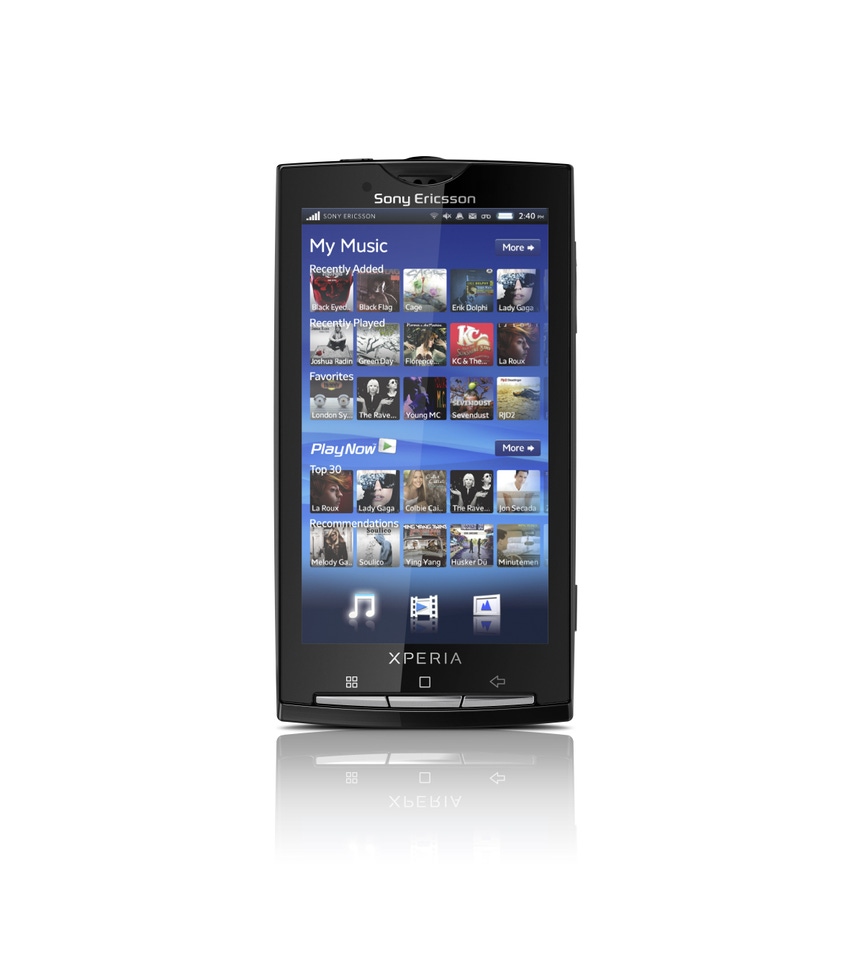
Handset vendor Sony Ericsson has reported net profit of €8m for the Q4 2010, marking its fourth consecutive quarter in profit. Net income for full year 2010 was €90m, the firm said, compared to a loss of €836m for 2009. President and CEO Bert Nordgberg described 2010 as “a turnaround year” for Sony Ericsson, and attributed improvements in the firm’s fortunes to its “shift towards an Android-based smartphone portfolio.”
January 20, 2011

Handset vendor Sony Ericsson has reported net profit of €8m for the Q4 2010, marking its fourth consecutive quarter in profit. Net income for full year 2010 was €90m, the firm said, compared to a loss of €836m for 2009. President and CEO Bert Nordgberg described 2010 as “a turnaround year” for Sony Ericsson, and attributed improvements in the firm’s fortunes to its “shift towards an Android-based smartphone portfolio.”
Sony Ericsson’s determination to focus on quality in the higher end of the market appears to be paying dividends. Average selling price for the quarter was up year on year, from €120 to €136, and also for the full year, from €119 to €146.
But the firm’s new direction also necessitated a thinning of its portfolio as it stripped out lower end products, causing shipment volumes to drop to 43.1 million for the year, down from 57.1 million in 2009. Quarterly shipments were down to 11.2 million from 14.6 million year on year and, while there was a sequential improvement, it was only eight per cent; something Sony Ericsson attributed to “a lack of new product launches during the quarter”.
2010 saw Sony Ericsson complete its corporate overhaul, which involved reducing headcount by some 4,000 and decreasing annual Opex by more than €880m, the firm said.
As it did in 2010, Sony Ericsson will be holding a press conference on the eve of Mobile World Congress in February, where it is widely expected the long-awaited ‘Playstation Phone’ will be unveiled.
In another development, Sony Ericsson is suing US WiMAX player Clearwire over a perceived similarity in the two companies’ logos. It is thought that the action was brought because of fears that Clearwire’s plans to launch own-brand handsets into the market might cause confusion.
Sony Ericsson’s 2010 results. (Source: Sony Ericsson)
Q4 2009 | Q3 2010 | Q4 2010 | FY 2009 | FY 2010 | |
Number of units shipped (million) | 14.6 | 10.4 | 11.2 | 57.1 | 43.1 |
Sales (Euro m.) | 1,750 | 1,603 | 1,528 | 6,788 | 6,294 |
Gross margin (%) | 23% | 30% | 30% | 15% | 29% |
Operating income (Euro m.) | -181 | 63 | 39 | -1,018 | 159 |
Operating margin (%) | -10% | 4% | 3% | -15% | 3% |
Restructuring charges (Euro m.) | -150 | -4 | -3 | -164 | -42 |
Operating income excl. restructuring charges (Euro m.) | -32 | 67 | 43 | -854 | 202 |
Operating margin excl. restructuring charges (%) | -2% | 4% | 3% | -13% | 3% |
Income before taxes (IBT) (Euro m.) | -190 | 62 | 35 | -1,043 | 147 |
IBT excl. restructuring charges (Euro m.) | -40 | 66 | 39 | -878 | 189 |
Net income (Euro m.) | -167 | 49 | 8 | -836 | 90 |
Average selling price (Euro) | 120 | 154 | 136 | 119 | 146 |
About the Author(s)
You May Also Like


.png?width=300&auto=webp&quality=80&disable=upscale)


_1.jpg?width=300&auto=webp&quality=80&disable=upscale)


.png?width=800&auto=webp&quality=80&disable=upscale)