AT&T has released a horde of press releases detailing the amount of cash it has dropped on network upgrades in states and on individual markets, across the 2014-2016 period.
May 9, 2017

AT&T has released a horde of press releases detailing the amount of cash it has dropped on network upgrades in states and on individual markets, across the 2014-2016 period.
The telco might be struggling in a battle with a ‘mystery’ bidder in its quest to acquire Straight Path Communications and its portfolio of millimetre wave (mmWave) spectrum, but that hasn’t stopped the telco from dropping some healthy investments across the US in the last couple of years. These investments cover a wide range of upgrades to reliability, coverage, speed and overall performance for residents and business customers.
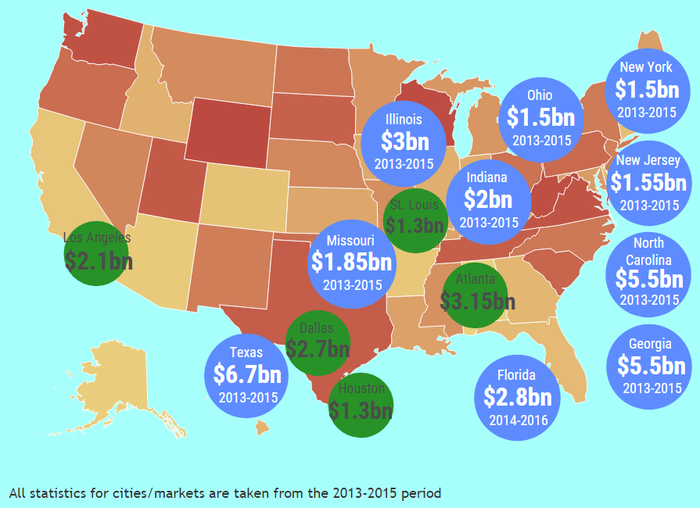
Although details on what it has spent recently were thin compared to previous years, we decided to collate all the data from previous announcements, so you can see how much the AT&T team like you and your home. Bear in mind this is a mix of investments from the 2013-15 as well as the 2014-16 figures which have just been announced. It isn’t the complete picture, but we can only work with what we’re given.
Texas is at the top of the list, which is perhaps understandable considering it is the second largest state by land mass and population, with $6.7 billion over the 2013-15 period, but it does appear some of the states are being slightly neglected. When you look at the table below, campaigns which promote broadband investments in the more rural areas might have a point…
Another interesting investment is in Atlanta. $3.15 billion is a huge amount considering it is only the 39th largest city in the country, with a population of just over 460,000.
AT&T has also outlined some ambitious aims in terms of one gigabit connections, as the team claims to currently serve 4.6 million locations across 52 major metro areas on a 100% fibre network, though the end goal is 75 major metros in total. It also plans to add two million locations in 2017, before eventually reaching 12.5 million locations by mid-2019. AT&T might need to pry the wallet open a bit further to meet these targets.
Below: Top 10 States by and Top 5 cities/regions by investment
Note: Your correspondent is not from the US so forgive sloppy geography

Investment in States |
Texas |
Georgia |
Illinois |
Florida |
Florida |
Indiana |
Missouri |
North Carolina |
New Jersey |
Ohio |
New York |
Washington |
Alabama |
Tennessee |
Louisiana |
Pennsylvania |
Mississippi |
Kansas |
Oklahoma |
Wisconsin |
South Carolina |
Virginia |
Nevada |
Mississippi |
Kentucky |
Virginia |
Arkansas |
Arkansas |
Connecticut |
Massachusetts |
Arizona |
Maryland |
Maryland |
Oregon |
West Virginia |
New Mexico |
Alaska |
New Mexico |
Iowa |
Hawaii |
South Dakota |
New Hampshire |
Nebraska |
Maine |
North Dakota |
Vermont |
Delaware |
Delaware |
Rhode Island |
Investment in specific regions |
Atlanta |
Dallas-Fort Worth-Arlington |
Los Angeles |
Houston |
St. Louis |
Seattle |
South Florida |
Detroit |
Philadelphia |
Phoenix |
Boston |
Orlando |
Phoenix |
Minnesota |
Orlando |
Cleveland |
Baltimore |
Charlotte |
Louisville |
Washington DC |
Raleigh/Cary |
Minneapolis-St. Pau |
Tampa Bay |
Tampa Bay |
Greensboro/High-Point |
Pittsburgh |
Durham/Chapel Hill |
Albuquerque |
Winston-Salem |
Sante Fe |
About the Author(s)
You May Also Like


.png?width=300&auto=webp&quality=80&disable=upscale)


_1.jpg?width=300&auto=webp&quality=80&disable=upscale)


.png?width=800&auto=webp&quality=80&disable=upscale)