RootMetrics has released its bi-annual report detailing the performance of the UK’s MNO’s, with EE hitting top-spot across the board, and O2 wallowing at the bottom of the rankings once again.
February 20, 2018

RootMetrics has released its bi-annual report detailing the performance of the UK’s MNO’s, with EE hitting top-spot across the board, and O2 wallowing at the bottom of the rankings once again.
EE collected the top award for each category measured by RootMetrics, with Three taking joint-first for the ‘Call Performance’ metric. While the margins of victory were certainly not a landslide, the fact that O2 sat at the bottom of the pile nationally, as well as pretty much every metric across the regions as well will possibly be more damaging for the brand than the rewards claimed by EE as the victor.
“We’re starting to see that capital expenditure in the latest network infrastructure, such as EE’s investment in VoLTE pays off in the form of improved customer experience,” said Scott Stonham, GM for RootMetrics in Europe.
“According to IHS Markit research, CAPEX is expected to grow moderately this year, and we will see the foundations being laid for fibre plant and 5G. It will be fascinating to see how the operators balance the creation of the networks of the future and maintaining and improving existing infrastructure.”
The rankings were calculated after RootMetrics took 708,000 tests over the second half of 2018 using a Samsung Galaxy S8, travelling more than 22,048 miles. These measurements also include 649 indoor locations across the UK and RootMetrics claim to have covered 100% of the population. The categories tested were overall performance; network reliability; network speed; data performance; call performance; and text performance.
Below, we’ve noted the performance of each of the brands:
UK | England | Wales | Scotland | Northern Ire | |
EE | 1st | 1st | 1st | 1st | Joint 1st |
Three | 2nd | 2nd | 2nd | 2nd | Joint 1st |
Vodafone | 3rd | 3rd | 3rd | 3rd | Joint 1st |
O2 | 4th | 4th | 4th | 4th | Joint 1st |
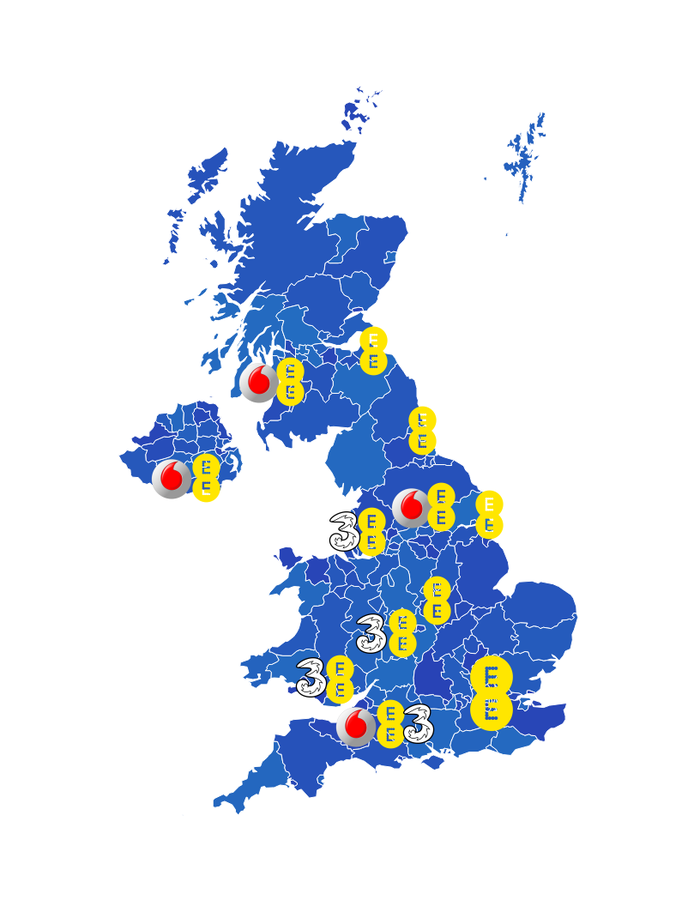
This is of course an overall summary of the performance of the brands, individual cities will vary. So if you are looking to change your contract over the next couple of months, the map below will tell you which provider you should go with depending on where you are in the UK.

About the Author(s)
You May Also Like


.png?width=300&auto=webp&quality=80&disable=upscale)


_1.jpg?width=300&auto=webp&quality=80&disable=upscale)


.png?width=800&auto=webp&quality=80&disable=upscale)