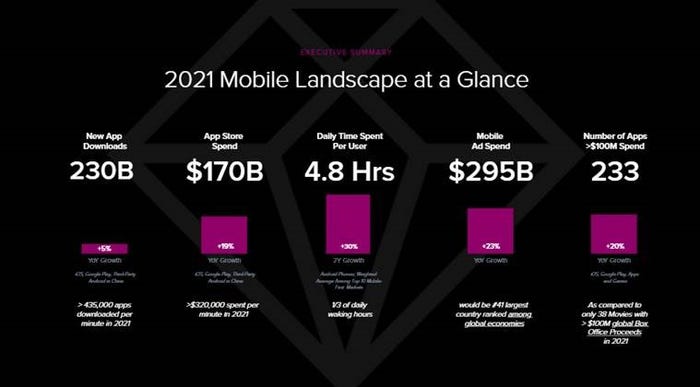
Analytics firm App Annie claims 230 billion apps were downloaded and $170 billion was spent on apps globally in 2021.
January 12, 2022

Analytics firm App Annie claims 230 billion apps were downloaded and $170 billion was spent on apps globally in 2021.
The firm’s annual State of Mobile report threw out a swarm of stats covering almost every conceivable mobile economy data set. Data in the report was pulled together based on the download, consumer spend and usage estimates available through App Annie Intelligence.
China took gold in the the most downloaded apps Olympics, clocking a staggering 98.4 billion. Second was India with 26.6 billion and third was the US with 12.2 billion. China also came top on consumer app spend at $56.8 billion. Second was the US with $44 billion and third Japan with $20.7 billion.
Here are some highlights of the 67 zillion other statistics published in the report.

Seven out of every ten minutes spent on mobile was spent on social, photo, and video apps. The report says “While Photo & Video apps (e.g. YouTube and TikTok) have seen an increase in market share of time spent, this has largely not been at the expense of current habits. Rather, consumers have turned historically ‘non-mobile’ time into time spent in apps and games.”
So basically we spent more time staring at our phones last year, probably because we were locked down for a lot of it, or at least working from home.
Two million new apps and games were released in 2021, which brings the total number of apps and games ever released on iOS and Google Play to over 21 million.
And it’s not all free-to-play tat – 233 apps or games generated over $100 million each, and 13 of them surpassed $1 billion, which is apparently up 20%.
There’s some demographic/behavioural stuff in the report as well. Apparently sports apps ‘overindex’ heavily with males in each market they looked at, whereas food and drink apps tended to skew more female. But the report ties itself in knots a bit when it comes to extrapolating much else:
“The difference can be subtle in the case of the US for food and drink and more dramatic in other markets like Japan,” it said. “We also see that the most used apps in each country tend to buck category. For instance, shopping apps on the whole tend to skew more female overall, yet Amazon skews more male in Japan, the UK, Germany, France and Canada. Only in the US does Amazon skew more female. Our analysis is limited to males and females only and is not representative of all gender identities.”
The number of total hours spent watching video streaming apps was up 16% on ‘pre-pandemic levels’. You could almost expect that total to go down in periods of global lockdown since you’re never far from the TV, but then it may be indicative of multiple people in the same house wanting to watch different things.
Demand for avatar social apps grew amid interest in metaverses during 2021, and consumer spend on dating apps passed the $4 billion mark in 2021, representing a 95% Increases since 2018. It’s not hard to imagine what spurred the growth here, since it was illegal to meet people in real life at various stages of the pandemic.
Mobile ad spend came in at $295 million, which was up 23% year on year and apparently means mobile now represents 70% of total ad spend.
Elsewhere, $116 billion was spent on mobile games – a 28% year on year Increase, finance app downloads clocked in at 5.9 billion, and 100 billion hours were spent on online shopping apps, up 18%.
Like when astronomers try explaining how far away other planets are, the numbers can get so far removed from anything you normally deal with that you could be forgiven for not really knowing what to do with the information, other than nod your head and agree that it is indeed a large number.
It’s probably sufficient to say by way of conclusion that it all goes to show just how massive the mobile app economy has become, and that covid related impacts on society over the last year perhaps exacerbated a number of growth trends. If you are likely to have to prove this point in a very specific way for some reason in the future, feel free to bookmark this article and deploy at your convenience.
About the Author(s)
You May Also Like


.png?width=300&auto=webp&quality=80&disable=upscale)


_1.jpg?width=300&auto=webp&quality=80&disable=upscale)


.png?width=800&auto=webp&quality=80&disable=upscale)