Almost one zettabyte of mobile data traffic in 2022 - Cisco
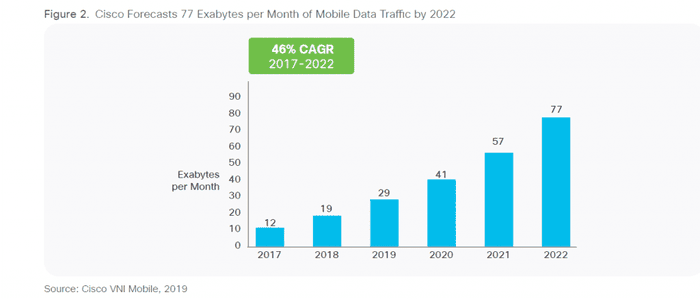
Cisco forecasts that 5G connections will go from nothing in 2017 to 3.4% of the global total in 2022. Over the same period annual mobile data traffic will reach 930 exabytes, a seven-fold growth.
February 20, 2019

Cisco forecasts that 5G connections will go from nothing in 2017 to 3.4% of the global total in 2022. Over the same period annual mobile data traffic will reach 930 exabytes, a seven-fold growth.
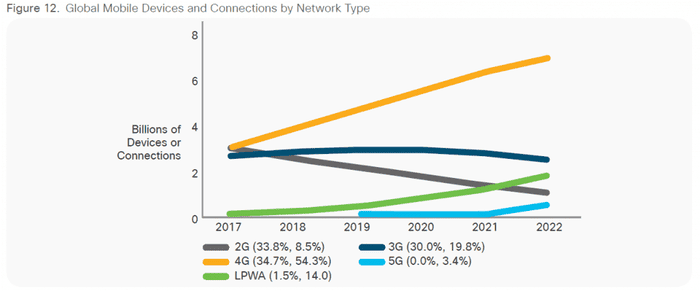
The report provides plenty of valuable data points for the industry, both of records of recent history and predictions of the near future. For example, despite the expected fast growth of 5G, by 2022, 4G will continue to dominate both the number of connections and the data generated. 54% of total connections will be on 4G, which will generate 71% of total mobile data traffic. Mobile data traffic will represent 20% of all IP traffic by 2022.
With regard to data traffic by individual devices, on average a smartphone will generate 11 GB of traffic per month by 2022, up from 2GB in 2017. Mobile video will be responsible for even higher proportion of the total traffic. 59% of the total mobile data was video in 2017. This number will grow up to 79% by 2022, and the absolute data volume of mobile video will increase by nine times.
The report identifies seven key global mobile networking trends, from Cisco’s perspective.
Evolving toward Smarter Mobile Devices: this largely refers to the high and increasing percentage of smartphones, including phablets, in all the connected devices (from 50% to 54%), as well as the fast growth of M2M connections (from 11% to 31%). Main segment losing out will be non-smartphones (from 34% to 10%).
Defining Cell Network Advances: this trend refers to the accelerated growth of mobile connections on newer technologies (4G and 5G) in contrast to the fast decline of the number of 2G connections and the gradual decline of 3G connections. Another fast-growing segment is M2M on Low-Power Wide-Area (LPWA) networks, increasing from 130 million in 2017 to 1.8 billion by 2022.

Measuring Mobile IoT Adoption: captured in this trend is the continued growth of M2M and wearable connections. Globally, M2M connections will grow from just under 1 billion in 2017 to 3.9 billion by 2022, a CAGR of 32%. Wearables are treated as a subset of M2M connections by Cisco. The report forecasts 1.1 billion wearable devices globally by 2022, more than double the volume of 526 million in 2017, with a CAGR of 16%. Among them, 10% will have embedded cellular connectivity, up from 4% in 2017.
Expanding Role and Coverage of Wi-Fi: the volume of mobile data may be big, but the volume of mobile data going through Wi-Fi offload is even bigger. The report forecasts that 59% of all data from mobile connected devices will be offloaded to Wi-Fi in 2022, amounting to 111.4 exabytes per month, up from 54% offload, or 13.4 exabytes per month in 2017. To enable the fast growth of offload data volume, the report forecasts, there will also need to have much more Wi-Fi hotspots. It estimates that Wi-Fi hotspots (including homespots) will grow from 124 million in 2017 to 549 million by 2022.
Identifying New Mobile Applications and Requirements: in addition to video being the application category that generates the lion’s share of total mobile data traffic, VR, AR and Mixed Reality are also expected to experience a fast growth in the coming years. Globally, augmented and virtual reality traffic will grow from 22 petabytes per month in 2017 to 254 petabytes per month in 2022.
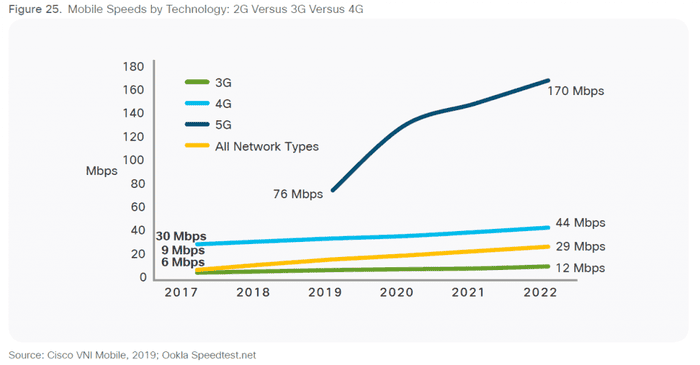
Comparing Mobile Network Speed Improvements: the speed of mobile data is determined by both the networks and devices. In particular with the accelerated 5G rollout in the forecast period, the report expects to see the average speed of mobile network connection to increase from 8.7 Mbps in 2017 to 41.6 Mbps in 2022. The speeds also vary vastly between technologies. While the average 4G speed is expected to grow from 30 Mbps in 2017 to 44 Mbps in 2022, the average 5G speed will increase from 76 Mbps in 2019 to 170 Mbps in 2022.

Reviewing Tiered Pricing, Unlimited Data and Shared Plans: the final trend examines what impact operators’ data packages and tiered pricing schemes will have on customers’ data consumption patterns. One interesting finding is that, a combined effect of all users increasing their data usage and more operators reintroducing data package cap has driven the proportion of data generated by the top 1% of users down from 52% in 2010 to only 6% in 2018.
The Visual Networking Index is produced by combining Cisco’s proprietary data and assumptions with that published by professional research firms as well as by the ITU.
About the Author
You May Also Like


.png?width=300&auto=webp&quality=80&disable=upscale)


_1.jpg?width=300&auto=webp&quality=80&disable=upscale)