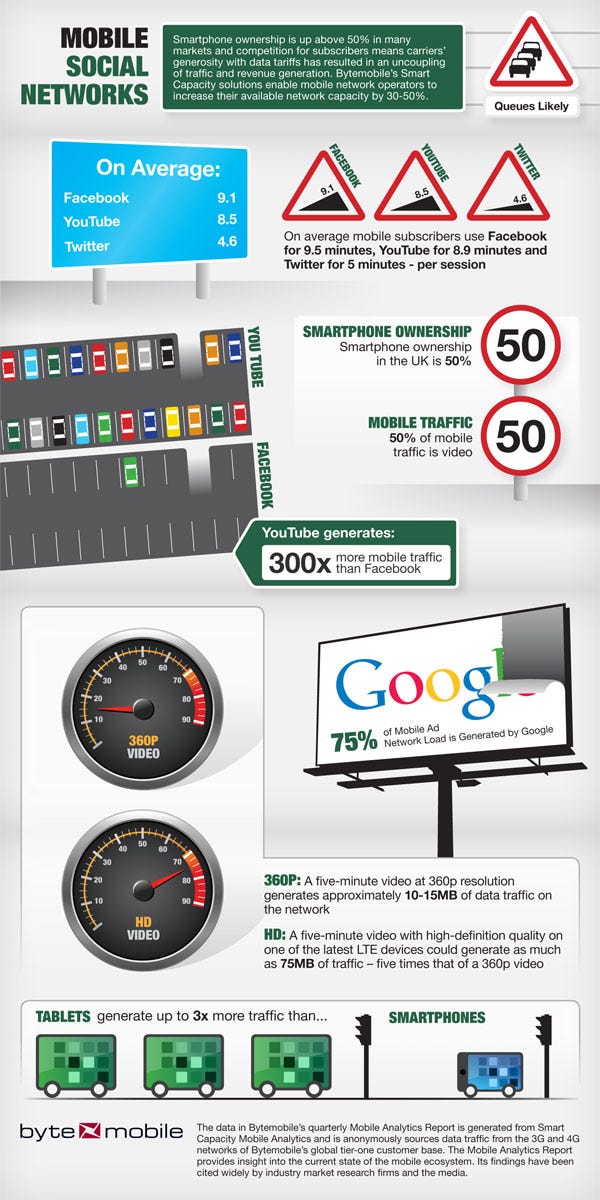
Mobile social networking infographic
Bytemobile’s first Mobile Analytics Report of 2012 reveals that the average volume of video traffic on mobile networks has risen by ten percentage points since this time last year, to 50 per cent. Also, while the average subscriber uses YouTube and Facebook for roughly the same amount of time – about nine minutes per session – YouTube generates a staggering 350 times more traffic.
February 23, 2012


byte-info
Bytemobile’s first Mobile Analytics Report of 2012 gathered data from the log files of its tier 1 carrier customers to provide insight into the forces driving the explosion in smartphone and tablet usage.
The report reveals that the average volume of video traffic on mobile networks has risen by ten percentage points since this time last year, to 50 per cent. Also, while the average subscriber uses YouTube and Facebook for roughly the same amount of time – about nine minutes per session – YouTube generates a staggering 350 times more traffic.
An iPad user generates three times the data traffic that an iPhone subscriber does, while smartphone users spend an average of 4.57 minutes per session on Twitter, 8.51 minutes per session on YouTube and 9.06 minutes per session on Facebook.
The report also shows that a majority of traffic generated by iOS devices – 83 per cent – comes from just three native Apple apps – Media Player, Safari and App Store/iTunes, at 47 per cent, 21 per cent and 15 per cent, respectively. The single most used app is Safari, which accounts for over 60 per cent of transactions between the device and the network.
About the Author
You May Also Like


_1.jpg?width=300&auto=webp&quality=80&disable=upscale)
